
High-resolution imaging of the evolving bipolar outflows in symbiotic novae: The case of the RS Ophiuchi 2021 nova outburst
Rocco Lico
Some of these systems are classified as recurrent novae because they undergo multiple eruptions within human timescales, as the companion star continuously feeds the white dwarf’s dense atmosphere after each ignition. RS Ophiuchi (RS Oph) is one of the most well-known recurrent novae, with at least seven recorded eruptions, occurring in 1898, 1933, 1958, 1967, 1985, 2006, and most recently, in 2021. What makes RS Oph particularly intriguing is that it belongs to the class of symbiotic novae, where the white dwarf’s companion is a red giant—a strong mass-loser that creates a dense environment around the binary system, leading to exceptionally dramatic explosive events.
The RS Oph outburst of August 2021 was bright across the electromagnetic spectrum, from radio to gamma-ray energies, and became the first nova ever detected at very high energies (VHE, >100 GeV), demonstrating that such systems can accelerate particles to extreme energies. To gain deeper insight into the physical mechanisms driving this explosive event and to track the expansion geometry of the ejected material, we conducted a radio VLBI monitoring with the European VLBI Network (EVN) at 1.6 and 5 GHz. These observations spanned from approximately two weeks (mid-August—we are grateful to the EVN observatory staff for their prompt reaction and support in the middle of the summer!) to two months (early October) after the 2021 explosion. Some of these EVN observations featured the e-MERLIN interferometer and allowed us to characterise in great detail the evolving source morphology and the physical conditions of the surrounding medium in which the ejected material propagates.
The final images, presented in Fig. 1 at 5 GHz (left) and 1.6 GHz (right), reveal an elongated and evolving source morphology expanding along the east-west direction. By the last observing epoch (64-65 days after the explosion), the structure reaches a total extent of approximately 540 AU. More specifically, the images display a triple-component structure: a compact central component, which we identify as the core region based on the precise astrometric position provided by Gaia DR3, and two elongated lobes propagating in opposite directions along the east-west axis.
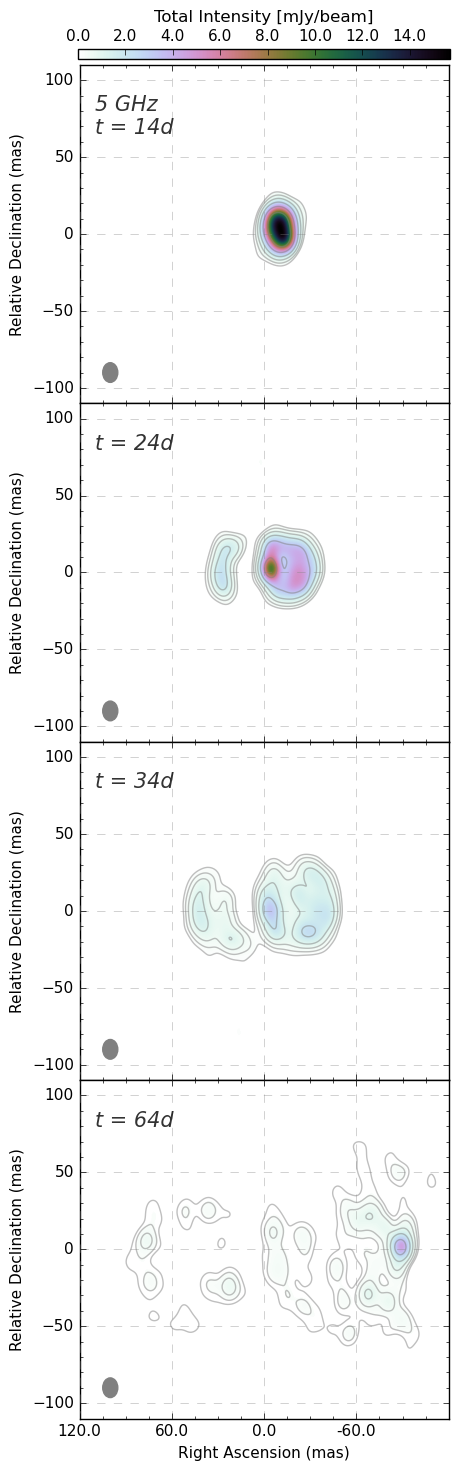
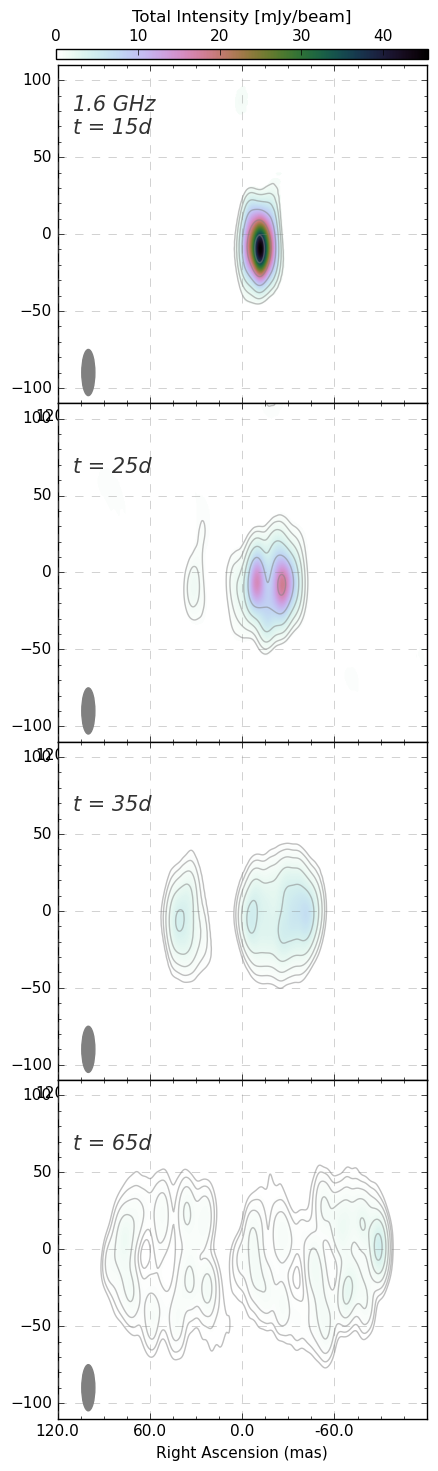
Figure 1. EVN + eMERLIN high resolution total intensity images at 5 GHz (left) and 1.6 GHz (right). The observing epoch, in units of days after the explosion, is indicated in the top-left corner of each image. The colour scale and the overlaid contours represent the total intensity emission, with the lowest contour at 2% of the map peak, and the image restoring beam (9.8 mas x 12.8 mas at 0 deg and 8.5 mas x 30.0 mas at 0 deg at 5 GHz and 1.6 GHz, respectively) is displayed in the bottom-left corner of each image.
A striking feature revealed by these images is the flux density depression between the eastern lobe and the rest of the source, which, as suggested by Munari et al. (2022), we interpret as absorption from ionized gas within the so-called density enhancement on the orbital plane (DEOP). This result indicates that, in addition to a massive accretion disk around the WD, most of the mass lost by the RG is channeled by the WD gravitational pull towards the orbital plane and create the observed density enhancement. The combined influence of the WD accretion disk and the DEOP confines the ejecta predominantly within the observed bipolar structure, expanding perpendicularly to the orbital plane.
The western side of this evolving structure corresponds to the approaching lobe, positioned in the foreground of the DEOP. It has a circular shape and appears brighter than the eastern side, which represents the receding lobe expanding behind the DEOP. The arc-like structure observed on the eastern side is interpreted as the outer edge of the eastern lobe emerging from behind the DEOP. Within this framework, we interpret the compact structure observed during the first epoch (14–15 days after the explosion) at both frequencies as the western lobe, with the core in the background and the eastern lobe entirely obscured by the DEOP. The eastern lobe becomes visible once it reaches a projected distance from the central binary where the DEOP optical depth drops below 1 (τ < 1). From the second observing epoch onward, the leading edge of the eastern lobe gradually emerges, growing until it appears similar in shape and extent to the western lobe. During this second epoch, the central core also becomes visible as a bright, compact structure with a brightness temperature of approximately ~5 × 10⁸ K at both frequencies, indicating the non-thermal nature of the emission.
By analysing the angular separation of the ejecta from the central region across different observing epochs, we determine that they expand at an average projected speed of approximately 7000 km/s, with no evidence of significant deceleration. This suggests that the density gradient perpendicular to the orbital plane is very steep, and most of the ejecta's deceleration likely occurred within the first two weeks after the explosion, before our observations began.
Another key finding of this study is the characterisation of the dense circumstellar environment surrounding RS Oph. We find that the density of the DEOP, along with its ionization degree, decreases radially as moving away from the central region, ranging from 1 x 107 cm-3 near the binary system to 9 x 105 cm-3 at approximately 400 AU. By integrating the density over the DEOP volume, we estimate its total mass to be 4.3 x 10⁻⁶ solar masses. Additionally, we calculate that the red giant companion loses mass at a rate of 6.8 x 10⁻⁸ solar masses per year, and this suggests that only about one-tenth of this mass is captured and accreted by the white dwarf, while the majority contributes to the DEOP and the surrounding circumstellar environment.
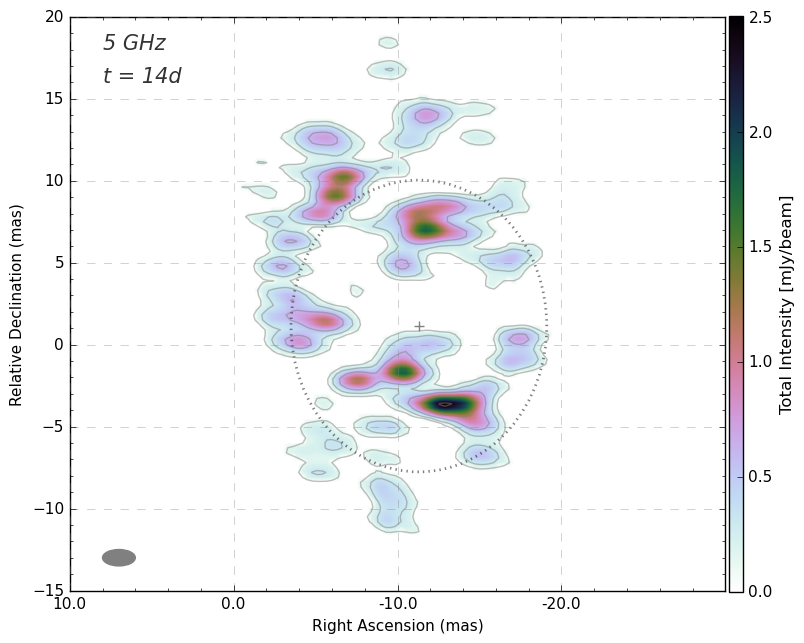
Figure 2. Full-resolution 5 GHz total intensity image during epoch I (14 days after T0) with relative coordinates referring to the Gaia DR3 astrometric position of RS Oph, corrected for proper motion. The convolving beam (1.0 mas x 2.0 mas at 90 deg) is displayed in the bottom-left corner of the image. The colour scale and the overlaid contours represent the total intensity emission, with the lowest contour at 5% of the map peak. The gray dots represent the best-fitting ellipse obtained by O'Brien et al. (2008) at the same frequency and epoch after the 2006 outburst.
A highly detailed image, presented in Fig. 2, was captured 14 days after the explosion at 5 GHz, utilizing the full resolution capabilities of the EVN. This image reveals a complex, elongated, and granular morphology, with multiple regions of enhanced brightness primarily concentrated along the outer rim of an approximately elliptical structure, extending ~30 mas in the north-south direction and ~20 mas in the east-west direction. These inhomogeneities within the expanding ejecta could be linked to the turbulent nature of shocks propagating through the pre-existing, and likely clumpy, slow-moving circumstellar material.
In conclusion, the extraordinary resolution and sensitivity of the EVN and e-MERLIN enabled us to trace the evolving morphology of the expanding bipolar ejecta in RS Ophiuchi and to characterise the physical conditions of the surrounding medium with unprecedented detail. These new observations provide one of the clearest views yet of how material is expelled and shaped during a nova explosion and will serve as a valuable point of comparison for the long-awaited and imminent eruption of T Coronae Borealis, another remarkable recurrent nova.
Link to the paper:
More information:
This paper is related to a previous one (Munari et al., 2022). You can read the summary of that paper here, published in the EVN Newsletter, Issue 64.
Contact:
Rocco Lico, Istituto di Radioastronomia (IRA-INAF) and Instituto de Astrofísica de Andalucía (IAA-CSIC). Email: rocco.lico@inaf.it