
Double SSA spectrum and magnetic field strength of the FSRQ 3C 454.3
Hyeon-Woo Jeong, Sang-Sung Lee, Whee Yeon Cheong, Jae-Young Kim, Jee Won Lee, Sincheol Kang, Sang-Hyun Kim, B. Rani, Jongho Park, and Mark. A. Gurwell
Relativistic jets of active galactic nuclei (AGN) emit synchrotron radiation via accelerated charged particles. One of the most prominent properties in powering, collimating, and accelerating the charged particles is magnetic (B) field lines around jets [1]. Thus, studying B-field environments, for example, field strength, can light up the unveiled physics on jets.
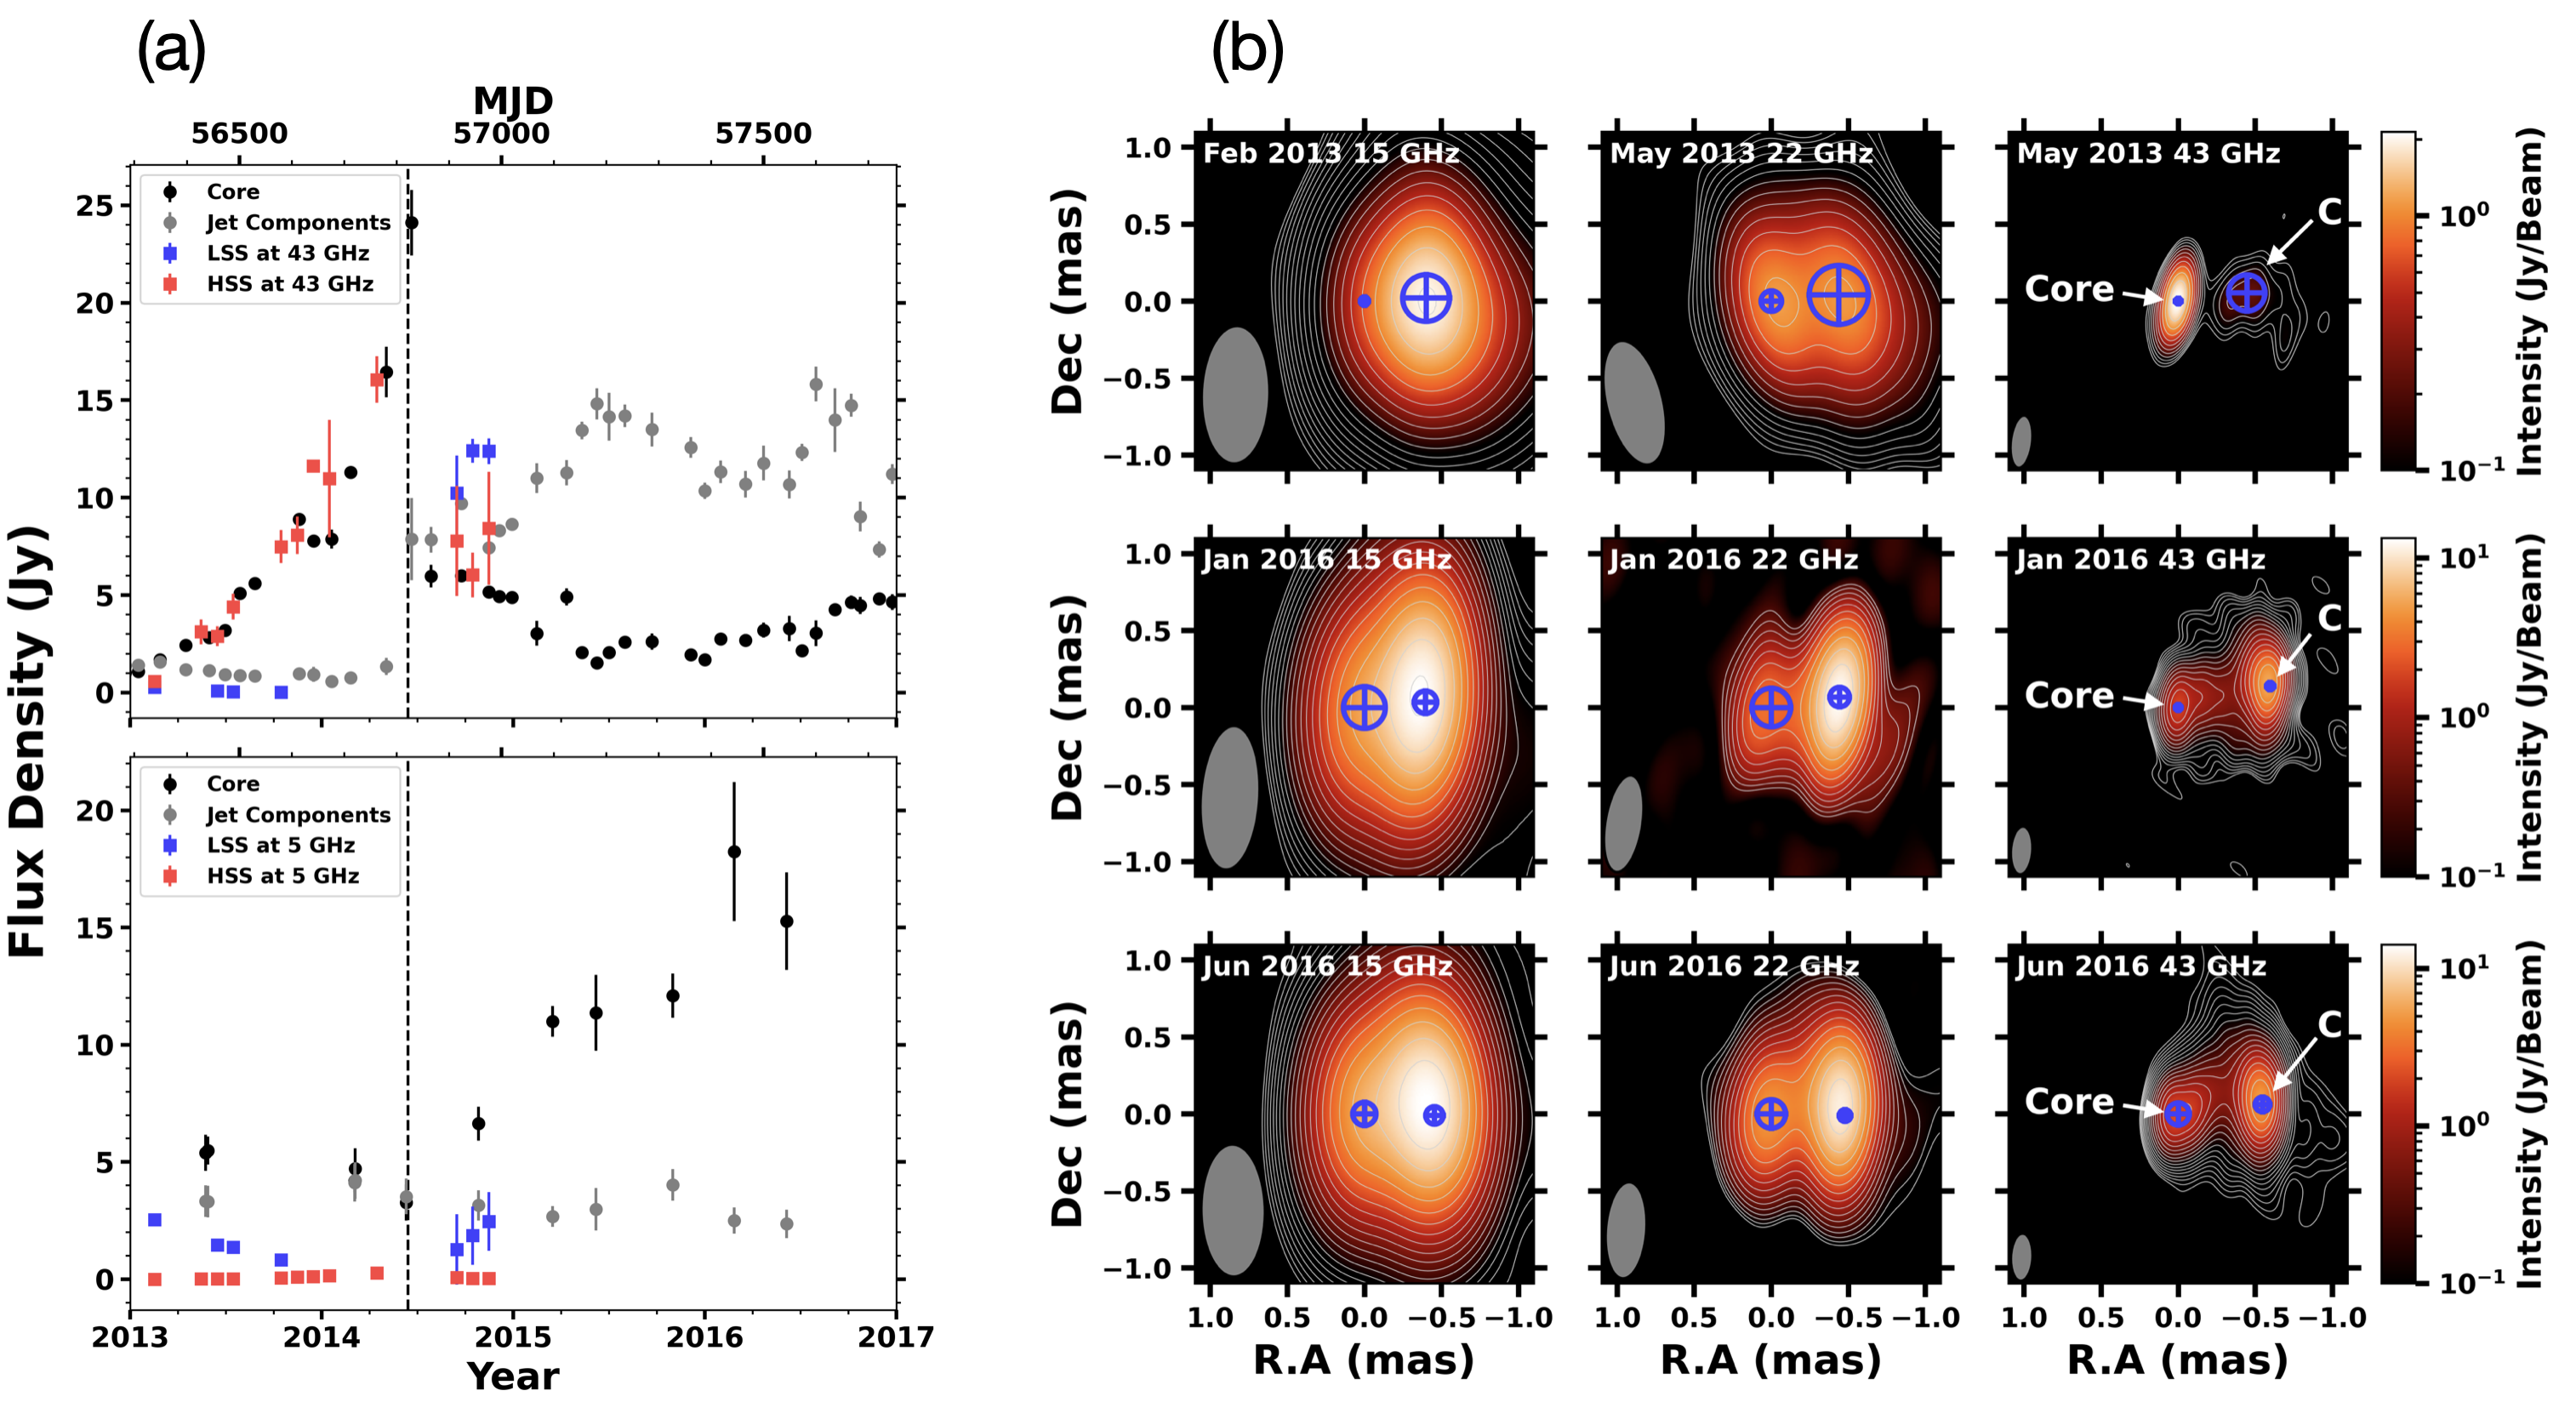
There are two methods to compute B-field strength in jets using an opacity effect of the emitting region: the core-shift effect (frequency-dependent core position offset) [2] and synchrotron selfabsorption (SSA). Although the core-shift effect can provide the B-field strengths of the radio core and 1pc from the central engine, the sparsity of the quasi-simultaneous multi-frequency VLBI observations restricts the usage of this method. Single-dish monitoring data, on the other hand, is relatively easy to collect in radio multi-frequency range. In this work, we collected single-dish measurements in the frequency range of 2.6 – 343 GHz to utilize the SSA analysis for the flat spectrum radio quasar (FSRQ) 3C 454.3. For more than a decade, 3C 454.3 has been reported to have the quasi-stationary component (C), ~0.5 milli-arcsecond (mas) away from the 43-GHz core.
Using light curves at 2.6, 4.9, 15, and 225 GHz, we computed the quiescent (non-variable)spectrum of the source by deconvolving with an exponential flare model [3]. After subtracting the quiescent spectrum from the observed spectrum (variable + non-variable), two distinctive individual SSA peaks were identified: the lower turnover frequency SSA spectrum (LSS) and the higher turnover frequency SSA spectrum (HSS). In the LSS, this spectrum shows a clear decrease in both flux density (Sm) and turnover frequency (𝜈m) until the 2014 June 𝛾-ray flare (𝛾2014). The amount of Sm in the LSS (2.5 to 1.0 Jy) is comparable to that of the EVN 5-GHz core (5.5 to 3.3 Jy), as well as the component C at 43 GHz (1.5 to 0.5 Jy). In the EVN 5 GHz observations, no significant flux density decrease was found from extended jet components, while the core flux density seems to follow that of the LSS at 5 GHz. Using the VLBA observations at 22 GHz, an optically thin spectrum on component C was found in 2013, which was well-matched to the LSS spectrum in the same period and optically thick spectra in 2016. These results indicate component C is another SSA component other than the core, and its spectrum varies over time. After the 𝛾2014 flare, a new jet component K14 was ejected from the 43-GHz core with a proper motion of 0.47±0.01 mas/yr [4], while component C dissipated away at 43 GHz. Therefore, the LSS spectrum attributed to component C before the 𝛾2014 and K14 after the 𝛾2014.
We evaluated the B-field strength on the surface of the SSA emitting region, where 𝜏=1 (BSSA), and by assuming equipartition condition between the energy densities of B-field and particle energy (BEQ) in both the LSS and the HSS. The estimated BSSA of the LSS is higher than the BEQ before the 𝛾2014 flare, indicating a possible magnetic-dominated condition. The magnetic dominance was also checked from the brightness temperature of C (≲1.5⨉1010 K) lower than that of the equipartition condition (≈5⨉1010 K) [5]. After the 𝛾2014 flare, the two B-field strengths are comparable to each other. In other words, K14 was in near equipartition condition after its ejection from the 43-GHz core. On the other hand, in the HSS, all the BSSA is lower than BEQ (i.e., particle-dominated).
Magnetic dominance can occur if component C is a compressed region in the downstream jet. In the previous study, component C was suggested as a recollimation shock. To further investigate if component C exhibits features related to recollimation shock, the jet ridgeline analysis was performed using the GMVA 86 GHz and the VLBA 43 GHz data in August 2015. This epoch was selected based on the proper motion of K14 and its arrival time on component C, and in this period, the 2015 August 𝛾-ray flare (𝛾2015) occurred. The jet ridgelines at two frequencies were obtained by selecting pixels showing the highest total intensity in every radius interval. At the position of component C, jet width suddenly decreases both at 43 and 86 GHz while the intensities increase. In addition to that, the moving component K14 exhibits re-brightening behavior as it approaches component C, while its angular size decrease until around the 𝛾2015 flare at 43 GHz. Moreover, the evaluated intrinsic brightness temperature of K14 (≈ (7±1)⨉1011 K) around August 2015, comparable to the Inverse-Compton limit (≈1012 K) [6], based on the typical Doppler factor, 𝛿=28.8 ± 2.2, of 3C 454.3 [7].
The decrease in jet width while showing re-brightening in flux density and possible relation to high-energy emitting region indicate a presence of recollimation shock in component C in the jet of 3C 454.3.
References
[1] Park J., & Algaba J. C., 2022, Galaxies, 10, 102
[2] Lobanov A. P., 1998, A&A, 330, 79
[3] Valtaoja E., Lahteenmaki A., Terasranta H., Lainela M., 1999, ApJS, 120, 95
[4] Liodakis I. et al., 2020, ApJ, 902, 61
[5] Readhead A. C. S., 1994, ApJ, 426, 51
[6] Kellermann K. I., Pauliny-Toth I. I. K., 1969, ApJ, 464, L55
[7] Weaver Z. R. et al., 2022, ApJS, 260, 12