Milliarcsecond structure and variability of methanol maser emission in three high-mass protostars
Artis Aberfelds
6.7 GHz methanol masers serve as crucial signal indicators in the context of high-mass star formation. It is believed that these Class II masers are radiation-pumped, and as such, their variability is closely linked to the variability of protostars. This connection renders the study of the variability of 6.7 GHz methanol masers a promising tool for investigating processes during high-mass star formation.
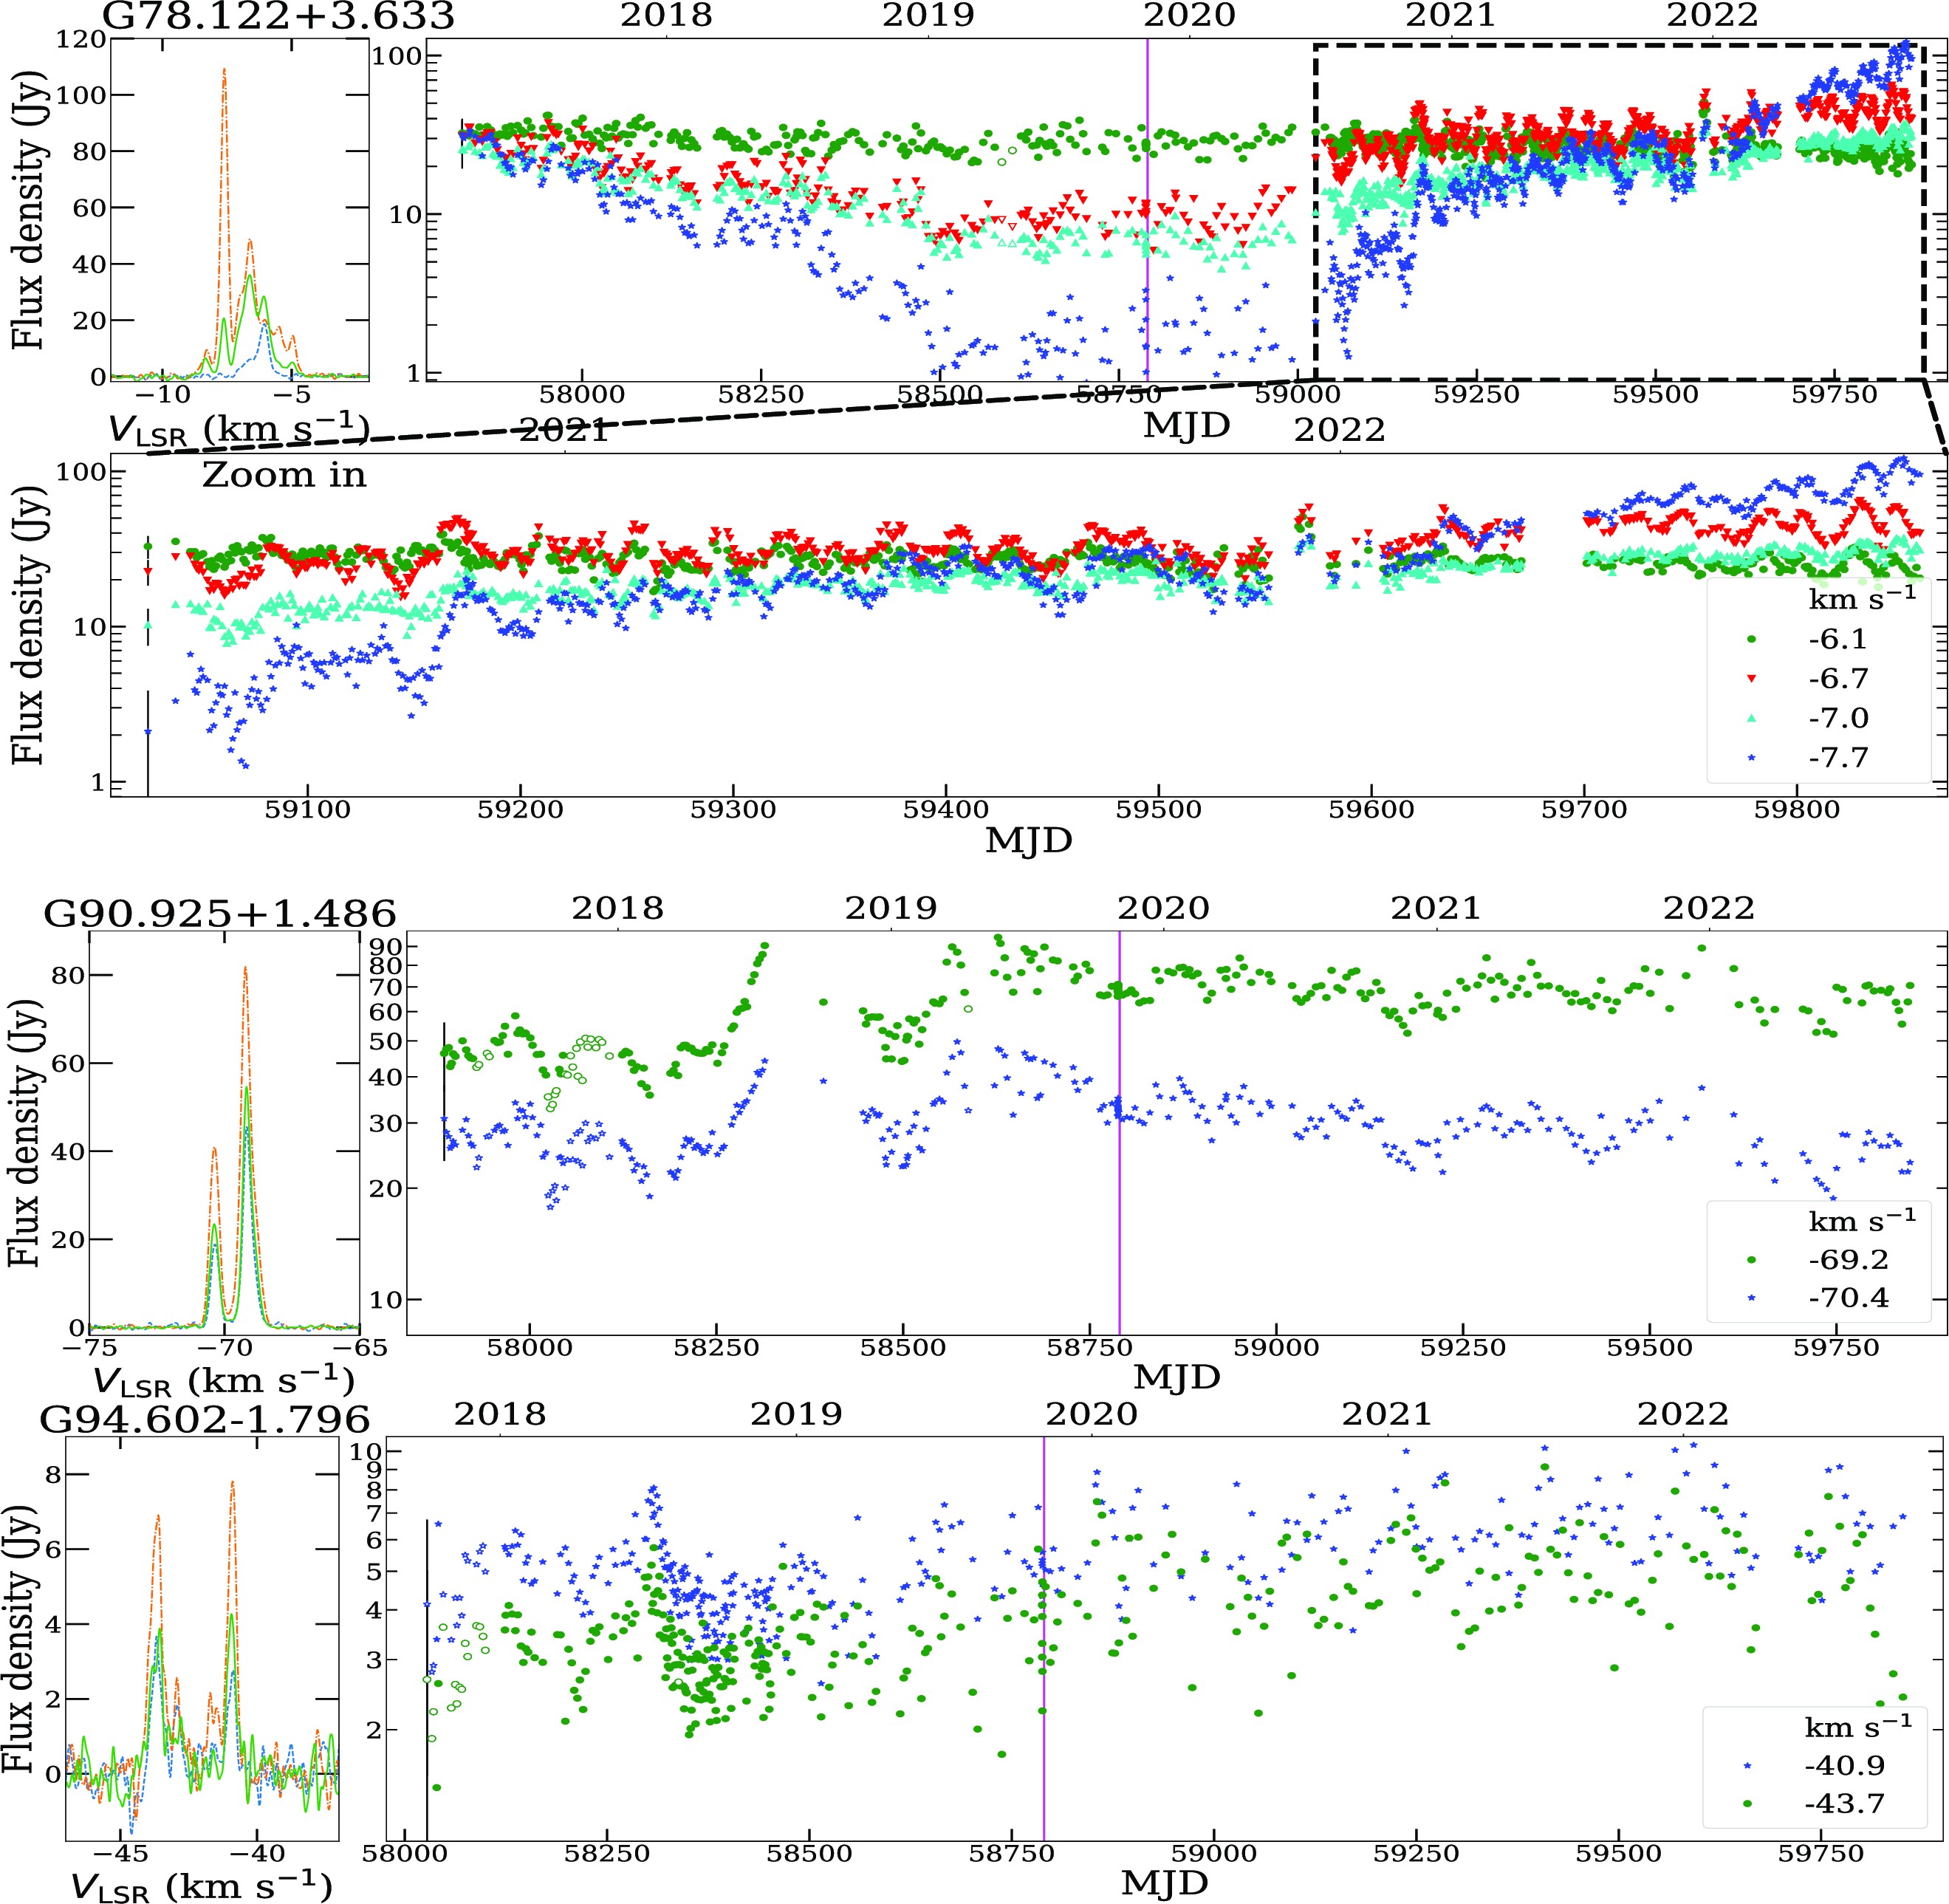
One of the locations where such studies are conducted is in Ventspils, Latvia, utilizing the Irbene radio telescopes. This monitoring program consistently observes 42 sources. In collaboration with the maser research team from Nicolaus Copernicus University in Torun, Poland, a joint study using the EVN was conducted. We selected and observed three methanol maser sources with different variability characteristics, obtaining milliarcsecond resolution images.
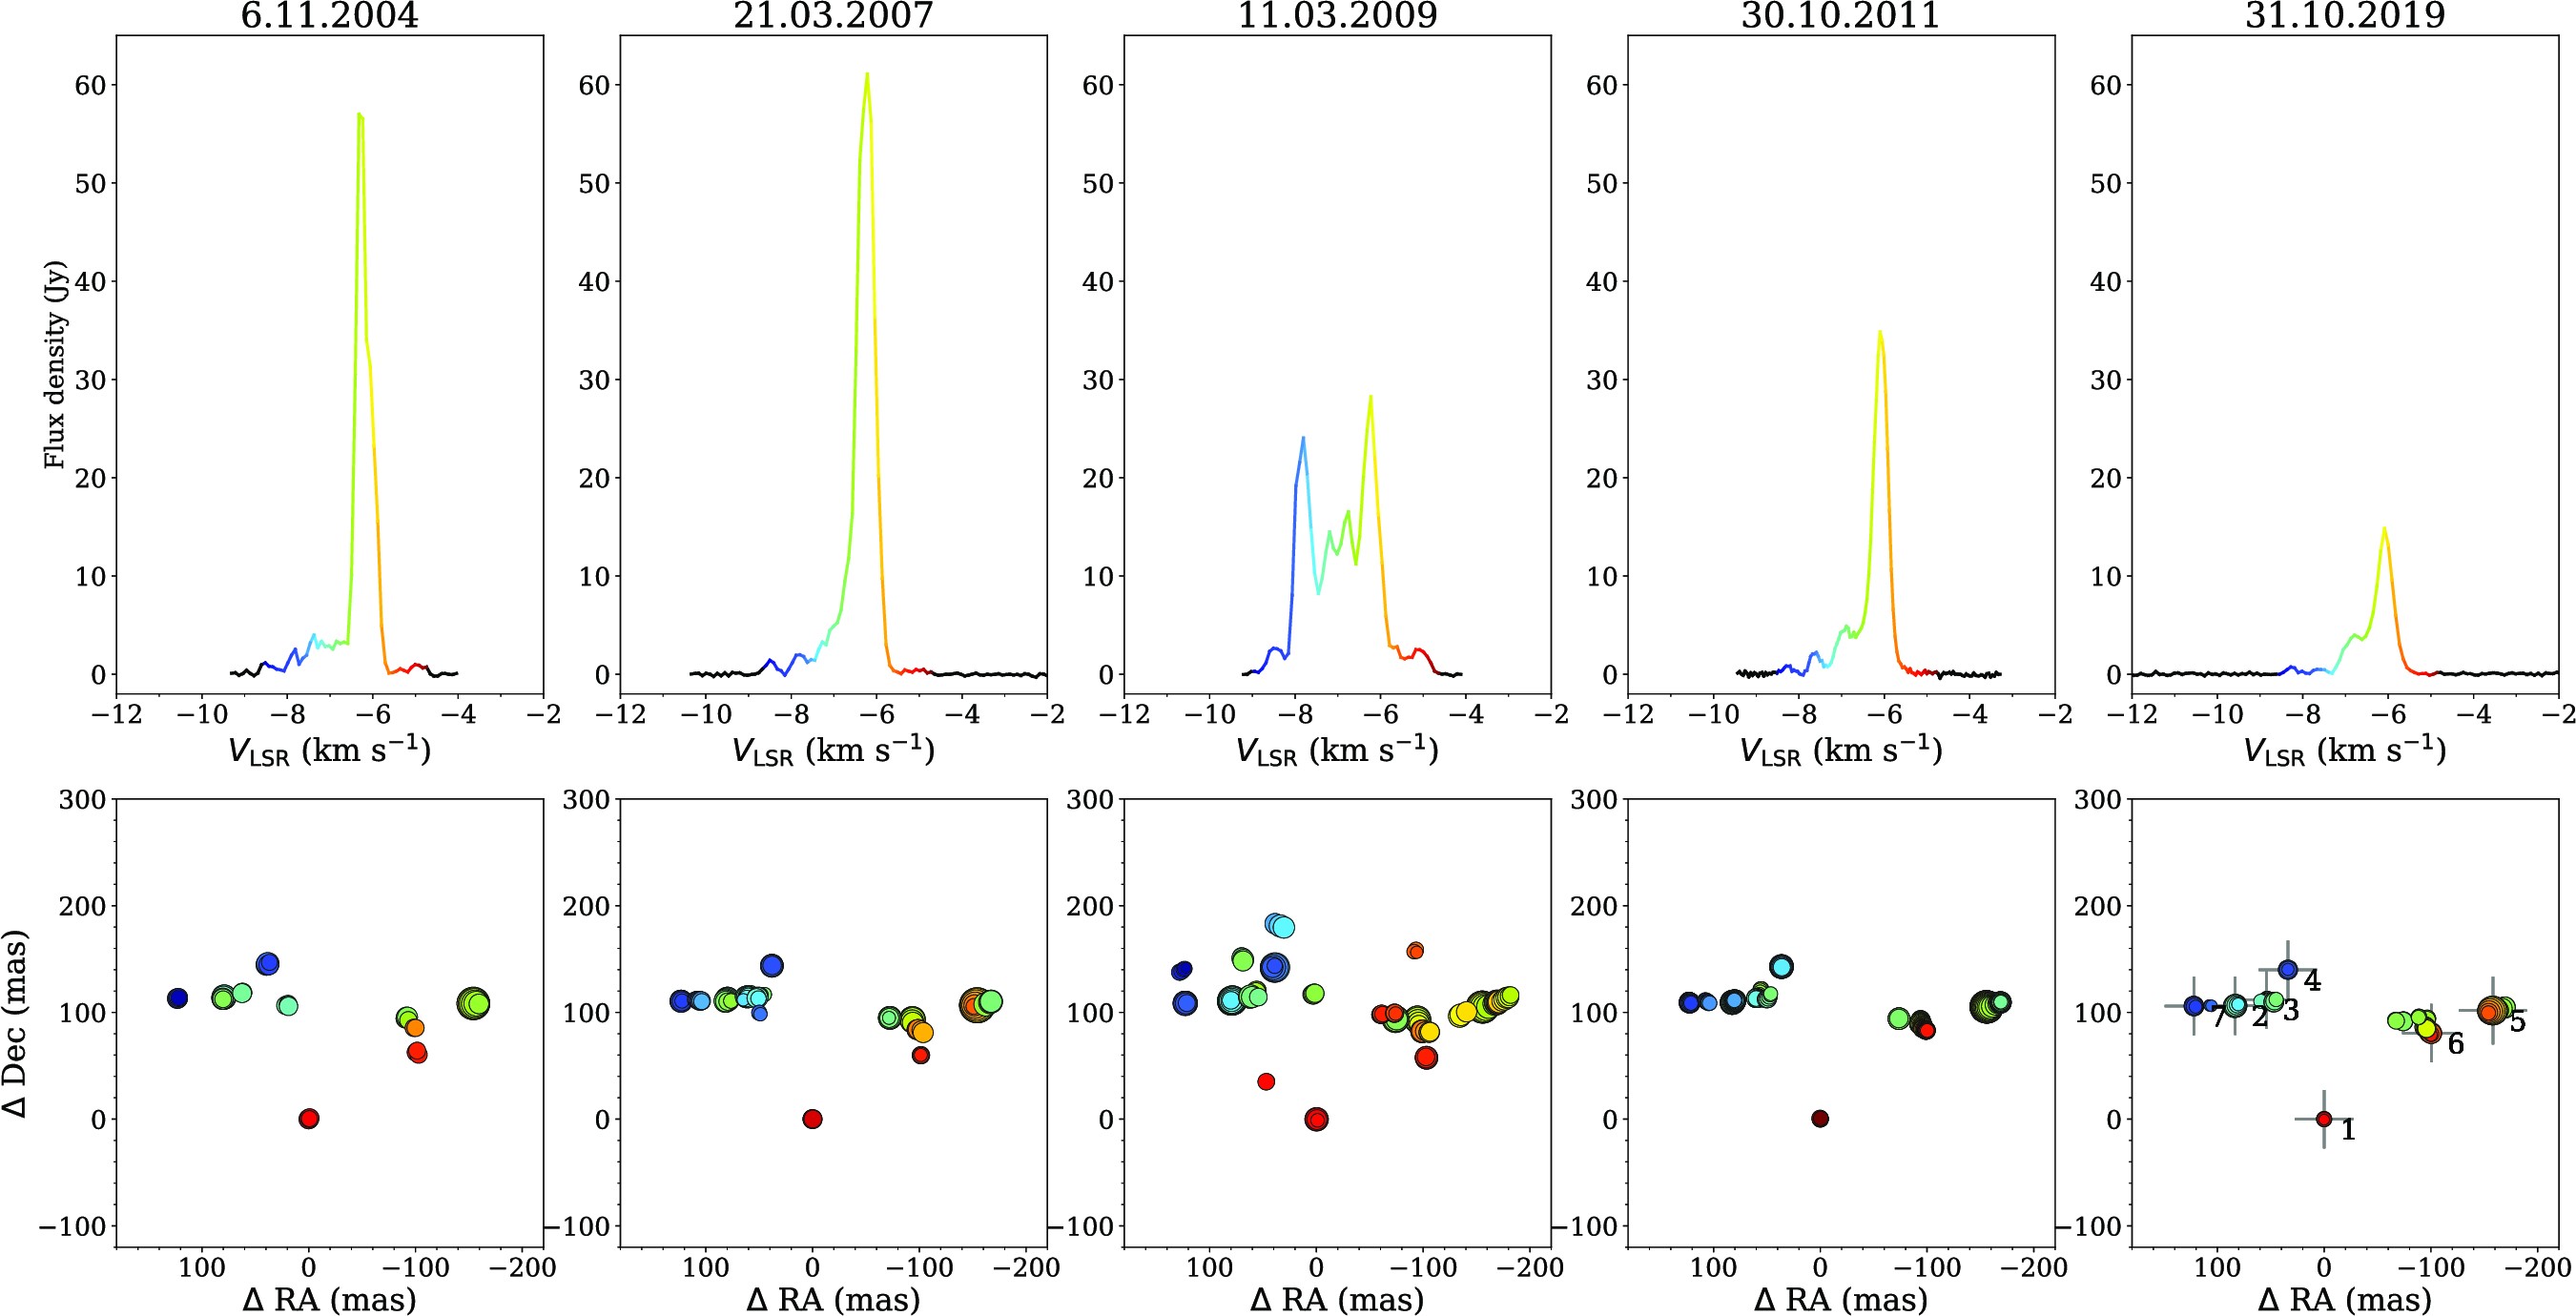
Two of the selected sources (G90.925+1.486 and G94.602−1.796) were observed for the first time with this resolution, revealing intriguing details. The first exhibits a spiral-arm-like distribution and strong velocity gradients directed inwards, suggesting large-scale gas infall. On the other hand, G94.602−1.796 displays a narrow structure. Combining this information with different frequency lines and continuum observations strongly indicates that we are observing the edge of a protoplanetary disk with masers.
G78.122+3.633, also known as IRAS 20126+4104, exhibited the most variability as seen by the Irbene radiotelescopes, but EVN images from our observation and archive showed practically no variation in structure. Upon examining individual maser cloudlets, we observed significant variations in structure, with indications that cloudlets with lower projected linear sizes are more variable. Combining information from single-dish monitoring and high-resolution images, we concluded that two groups of maser cloudlets, separated by approximately 200 AU, exhibit distinctly different variability patterns. Overall, our results support a scenario of variability due to changes in the maser pumping rate.
More information:
Monthly Notices of the Royal Astronomical Society, Volume 524, Issue 1, September 2023, Pages 599–618, https://doi.org/10.1093/mnras/stad1752
Contact:
Artis Aberfelds
Ventspils University of Applied Sciences, Ventspils, Latvia
Email: artis.aberfelds@venta.lv
Anna Bartkiewicz
Nicolaus Copernicus University, Torun, Poland
Email: annan@astro.uni.torun.pl